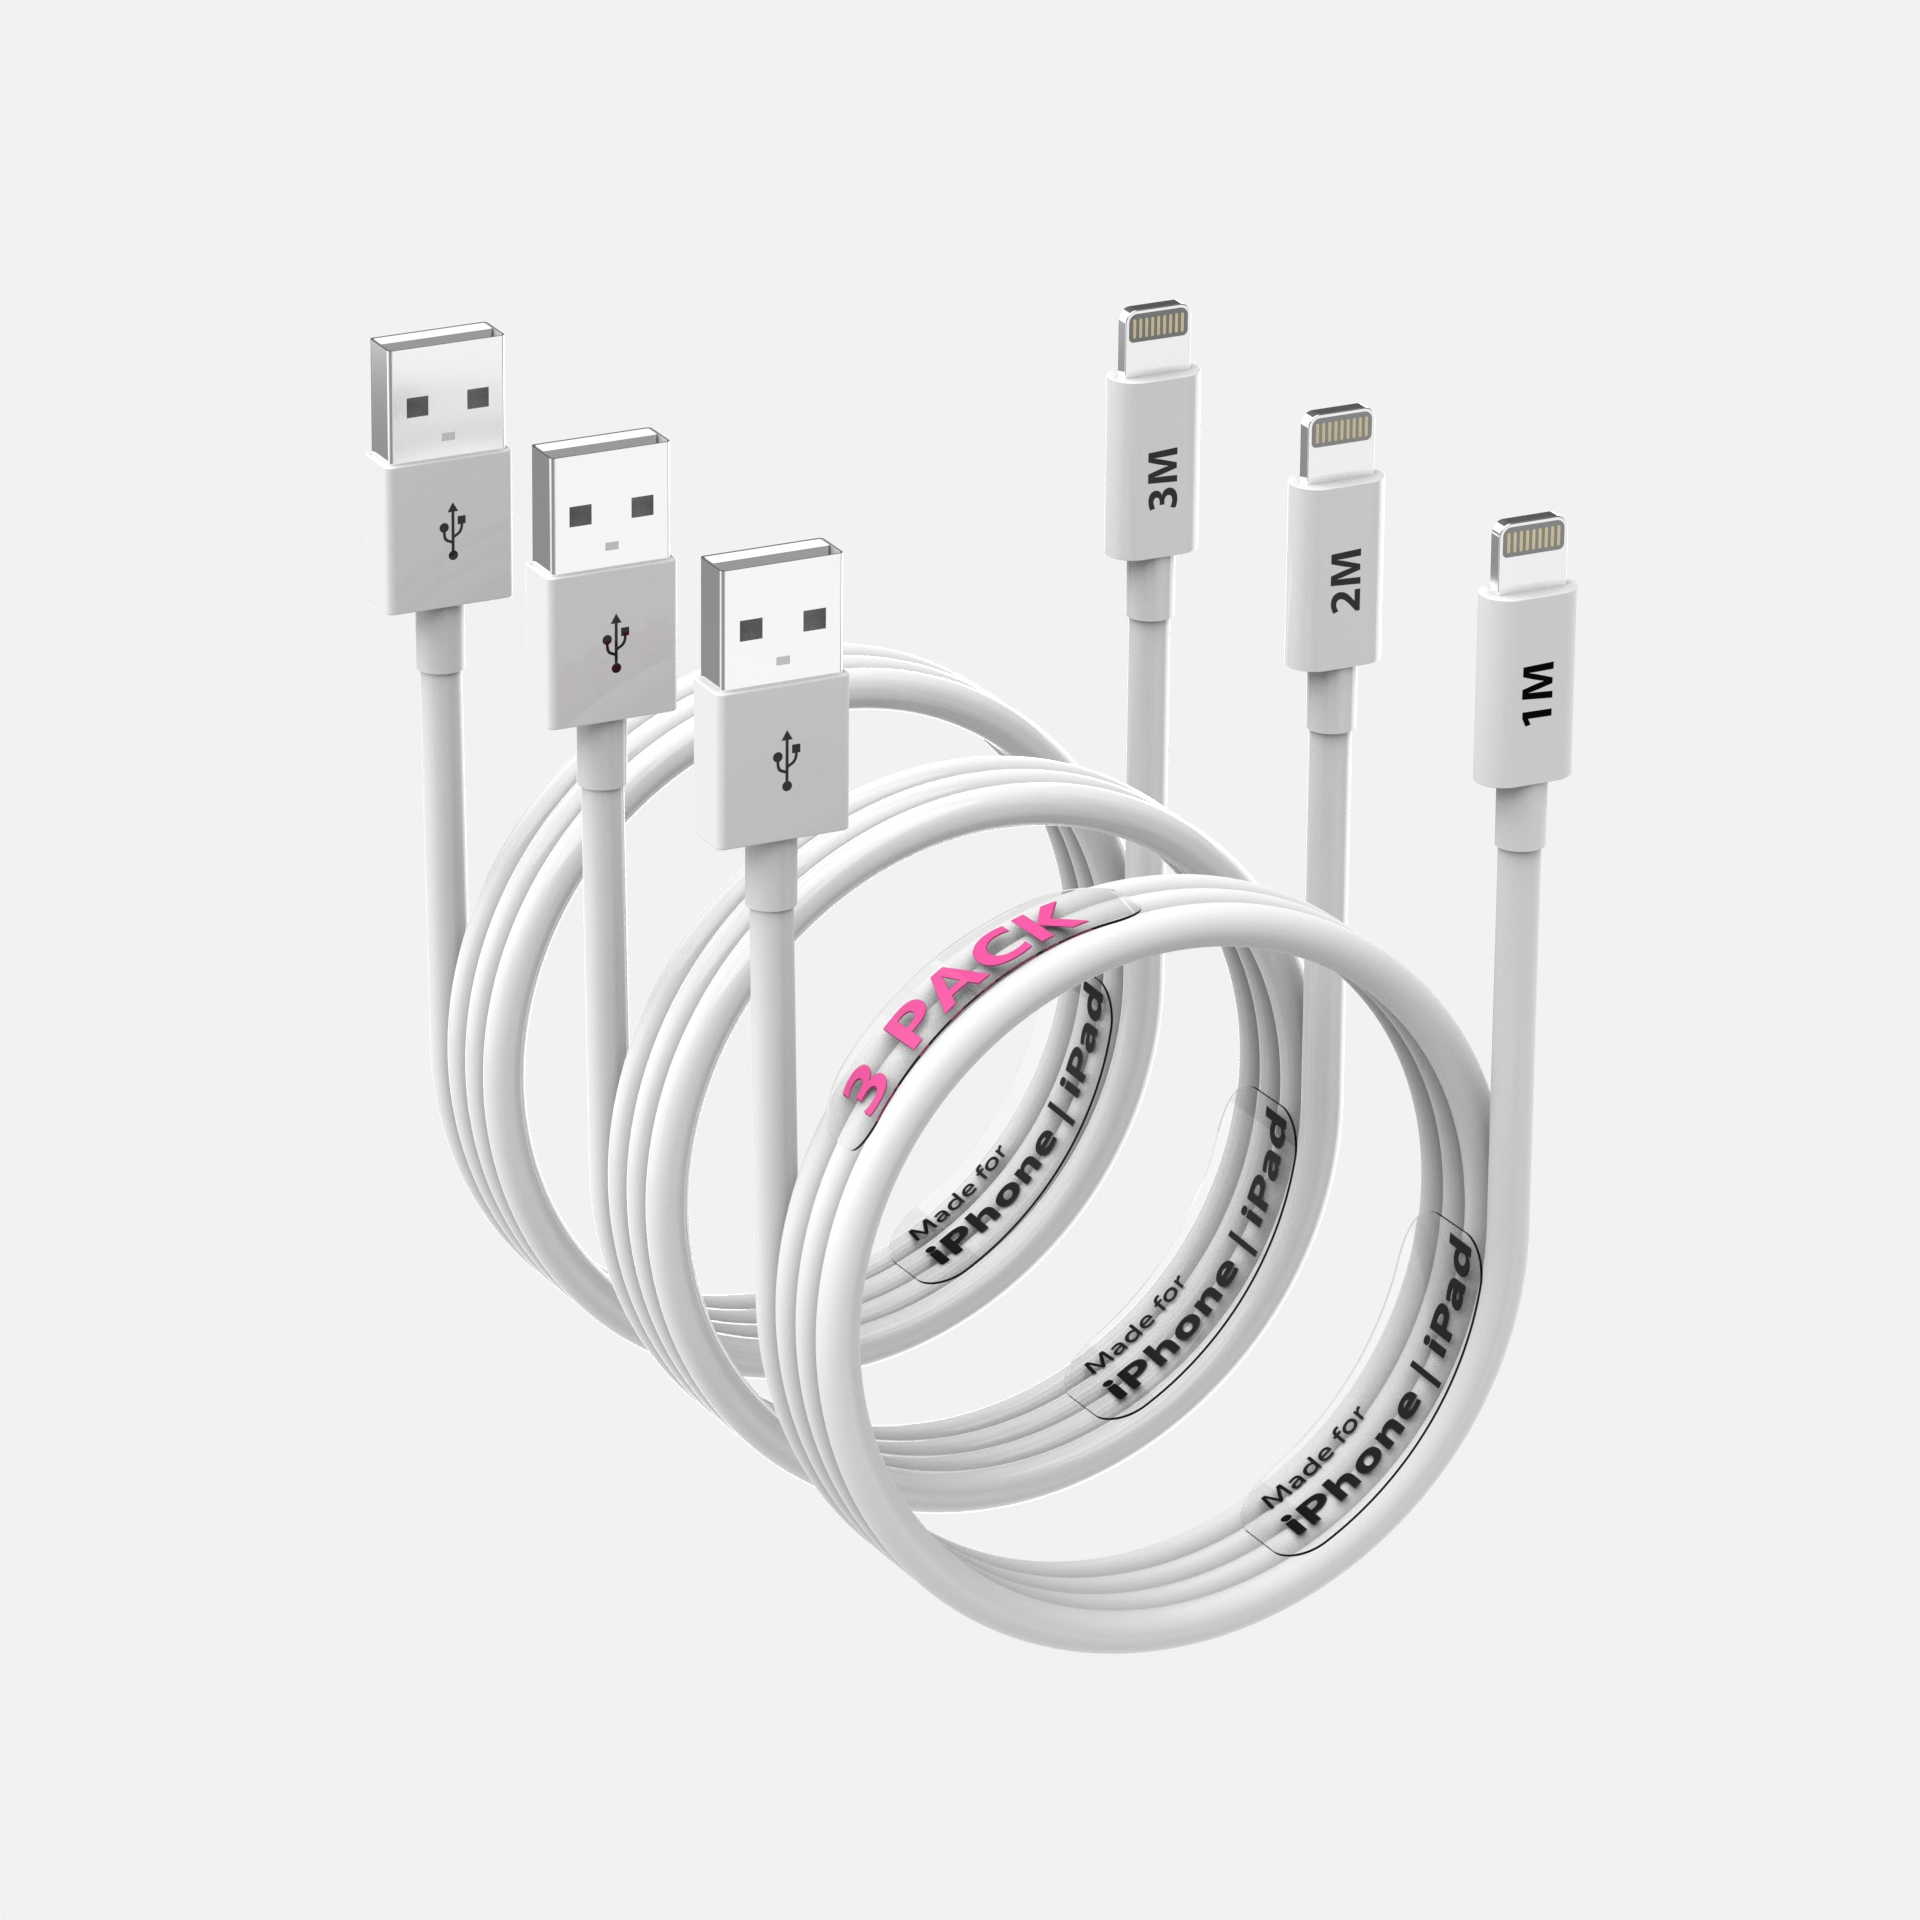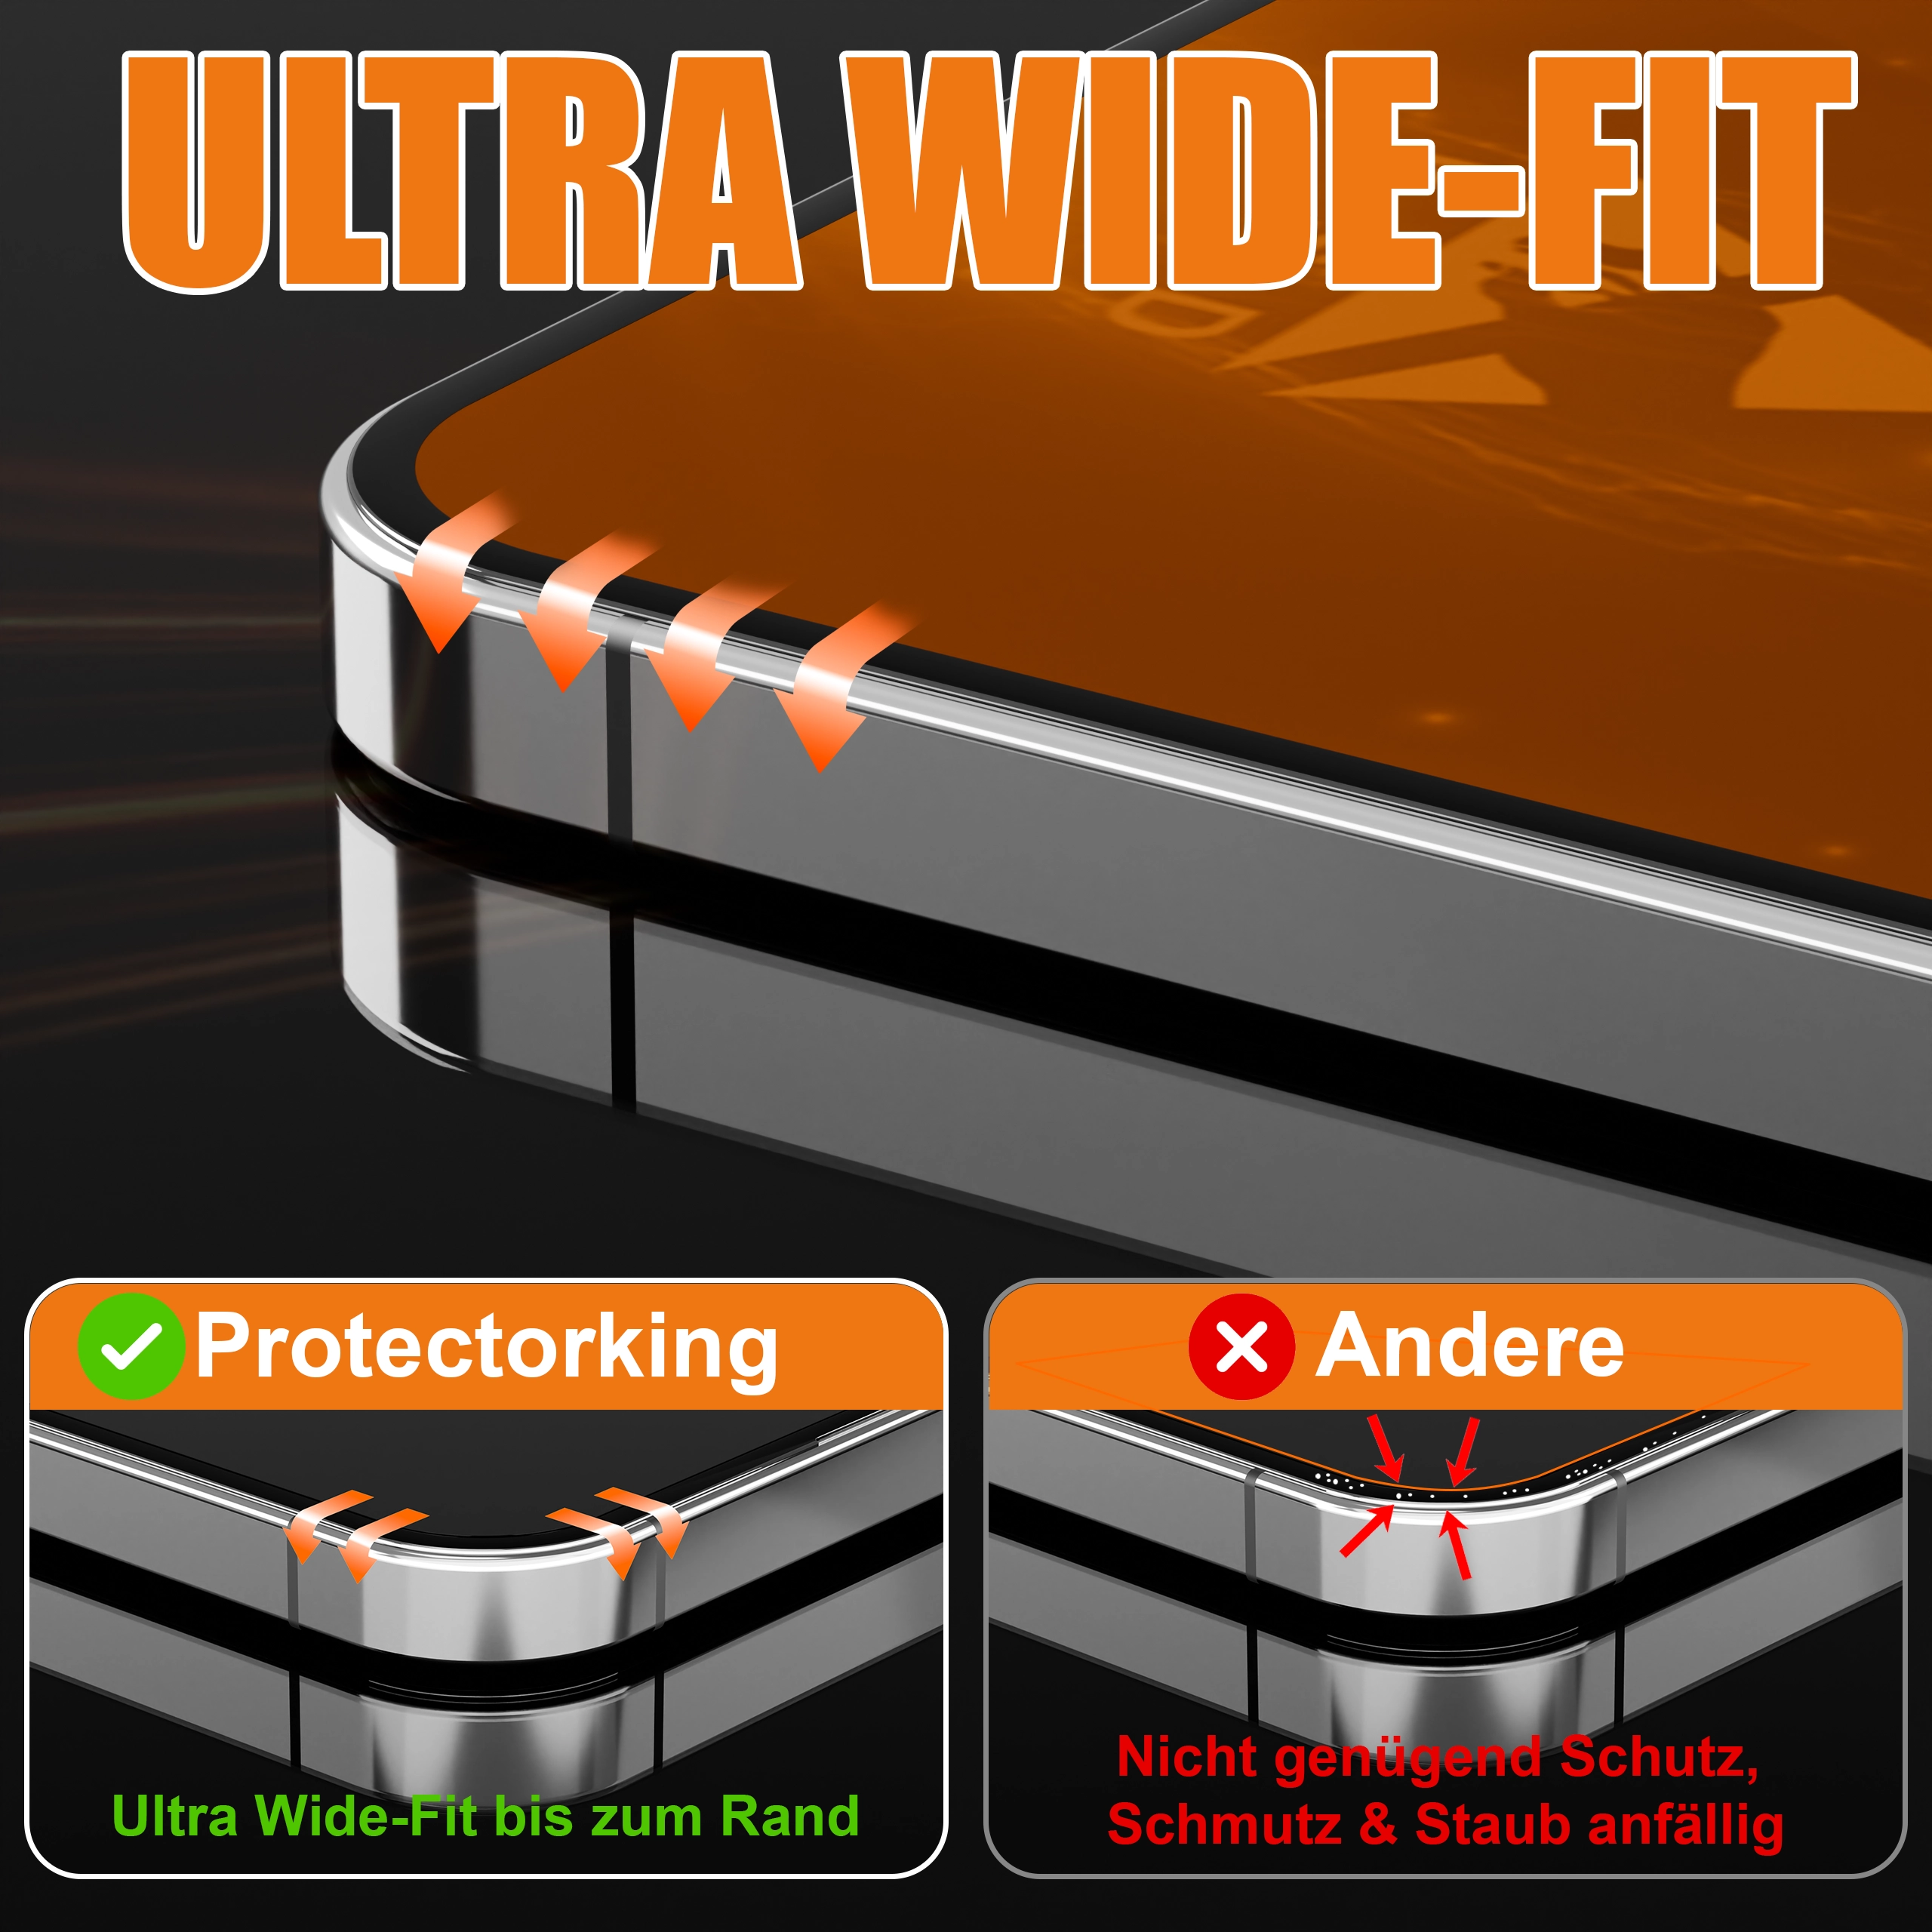
An infographic image has one job: transfer one idea into a shopper’s head in under three seconds, on a phone screen, while their thumb is already moving. Most infographics fail this test the same way, too many ideas, too much text, too little hierarchy. Here are the rules we design by.
One image, one idea
The most common failure: cramming six feature callouts around a product with arrows everywhere. On mobile, where the majority of Amazon browsing happens, that becomes an unreadable diagram. Each infographic gets a single message. Six messages means spreading them across your image sequence, not one canvas.
The three-second hierarchy
Every infographic needs an unmissable reading order: a short headline (five words or fewer), the product visual carrying the idea, and at most one supporting line. If a shopper only reads the headline, the image should still have done its job. Design the headline first; everything else supports it.
Text sizing: the phone test
Before any infographic ships, view it at actual thumbnail size on a phone. Text that requires zooming may as well not exist. Our working rule: if it is not legible at 350 pixels wide, the text is too small or there is too much of it. Usually both.
Icons clarify or they leave
Icons earn their place by replacing words, a droplet for waterproof, a shield for protection. Icons that merely decorate ("premium quality" next to a generic star) add noise and a faint whiff of the same stock-icon set every competitor uses. When in doubt, delete the icon and let the product visual speak.
The product visual is the foundation
Here is the uncomfortable truth: no layout rescues a bad product image. Infographics built on supplier photos with mismatched lighting look assembled; infographics built on a clean render, where the product can be posed, lit, cut open, or exploded to demonstrate the exact claim being made, look engineered. When the text says "five protective layers" and the image genuinely shows five separated layers, the claim stops being copy and becomes evidence.
Comparison infographics: punch fairly
"Us vs. ordinary alternatives" tables convert well and are allowed, naming competitors or misrepresenting them is not. Compare honestly against the generic option, keep the checkmark column visibly yours, and limit rows to four or five. Beyond that, mobile legibility collapses again.
Consistency across the set
All infographics in a listing should share fonts, colors, and visual language with each other and with your brand. A listing where every image looks designed by a different freelancer reads as exactly that.
Want infographic sets where the renders and the design come from the same hands? That is most of what we do all day, and the $130 test applies here too.
See this quality on your own product
First-time clients get a complete, high-resolution 3D render of their product for $130. Judge the quality before committing to a full package.